Visualization: The evolution of Python(vis.cs.ucdavis.edu)
vis.cs.ucdavis.edu
Visualization: The evolution of Python
http://vis.cs.ucdavis.edu/~ogawa/storylines/python.svg
11 comments
This seems to capture volume and frequency of change but not necessarily magnitude of change.
I do not think magnitude of change can be readily computed. It certainly is not measured in characters, bytes, or lines. For example, one checkin might toggle a #define that controls thousands of lines, another might just reorganize the order of declarations in a file.
[deleted]
There was a huge chart of the history of programming languages at my university. It showed which ones influenced others, and I'd look at it often. Oddly enough I didn't pay much attention to Python at the time focusing on all the lines coming into and out of Java. I've since discovered Python and really wish I could see that chart again. While this is very different it gave me a piece of that magic again. Thank you for posting this. :-)
Python is fairly conservative; as far as languages go, probably not the most interesting, which is exactly its charm.
I would group Python with Pike and Icon, as 2-week programming languages. It takes about 2-weeks of practice to start writing useful, sophisticated programs in them. Icon is the more interesting one of the three, it's a modern SNOBOL dialect with generators.
I would group Python with Pike and Icon, as 2-week programming languages. It takes about 2-weeks of practice to start writing useful, sophisticated programs in them. Icon is the more interesting one of the three, it's a modern SNOBOL dialect with generators.
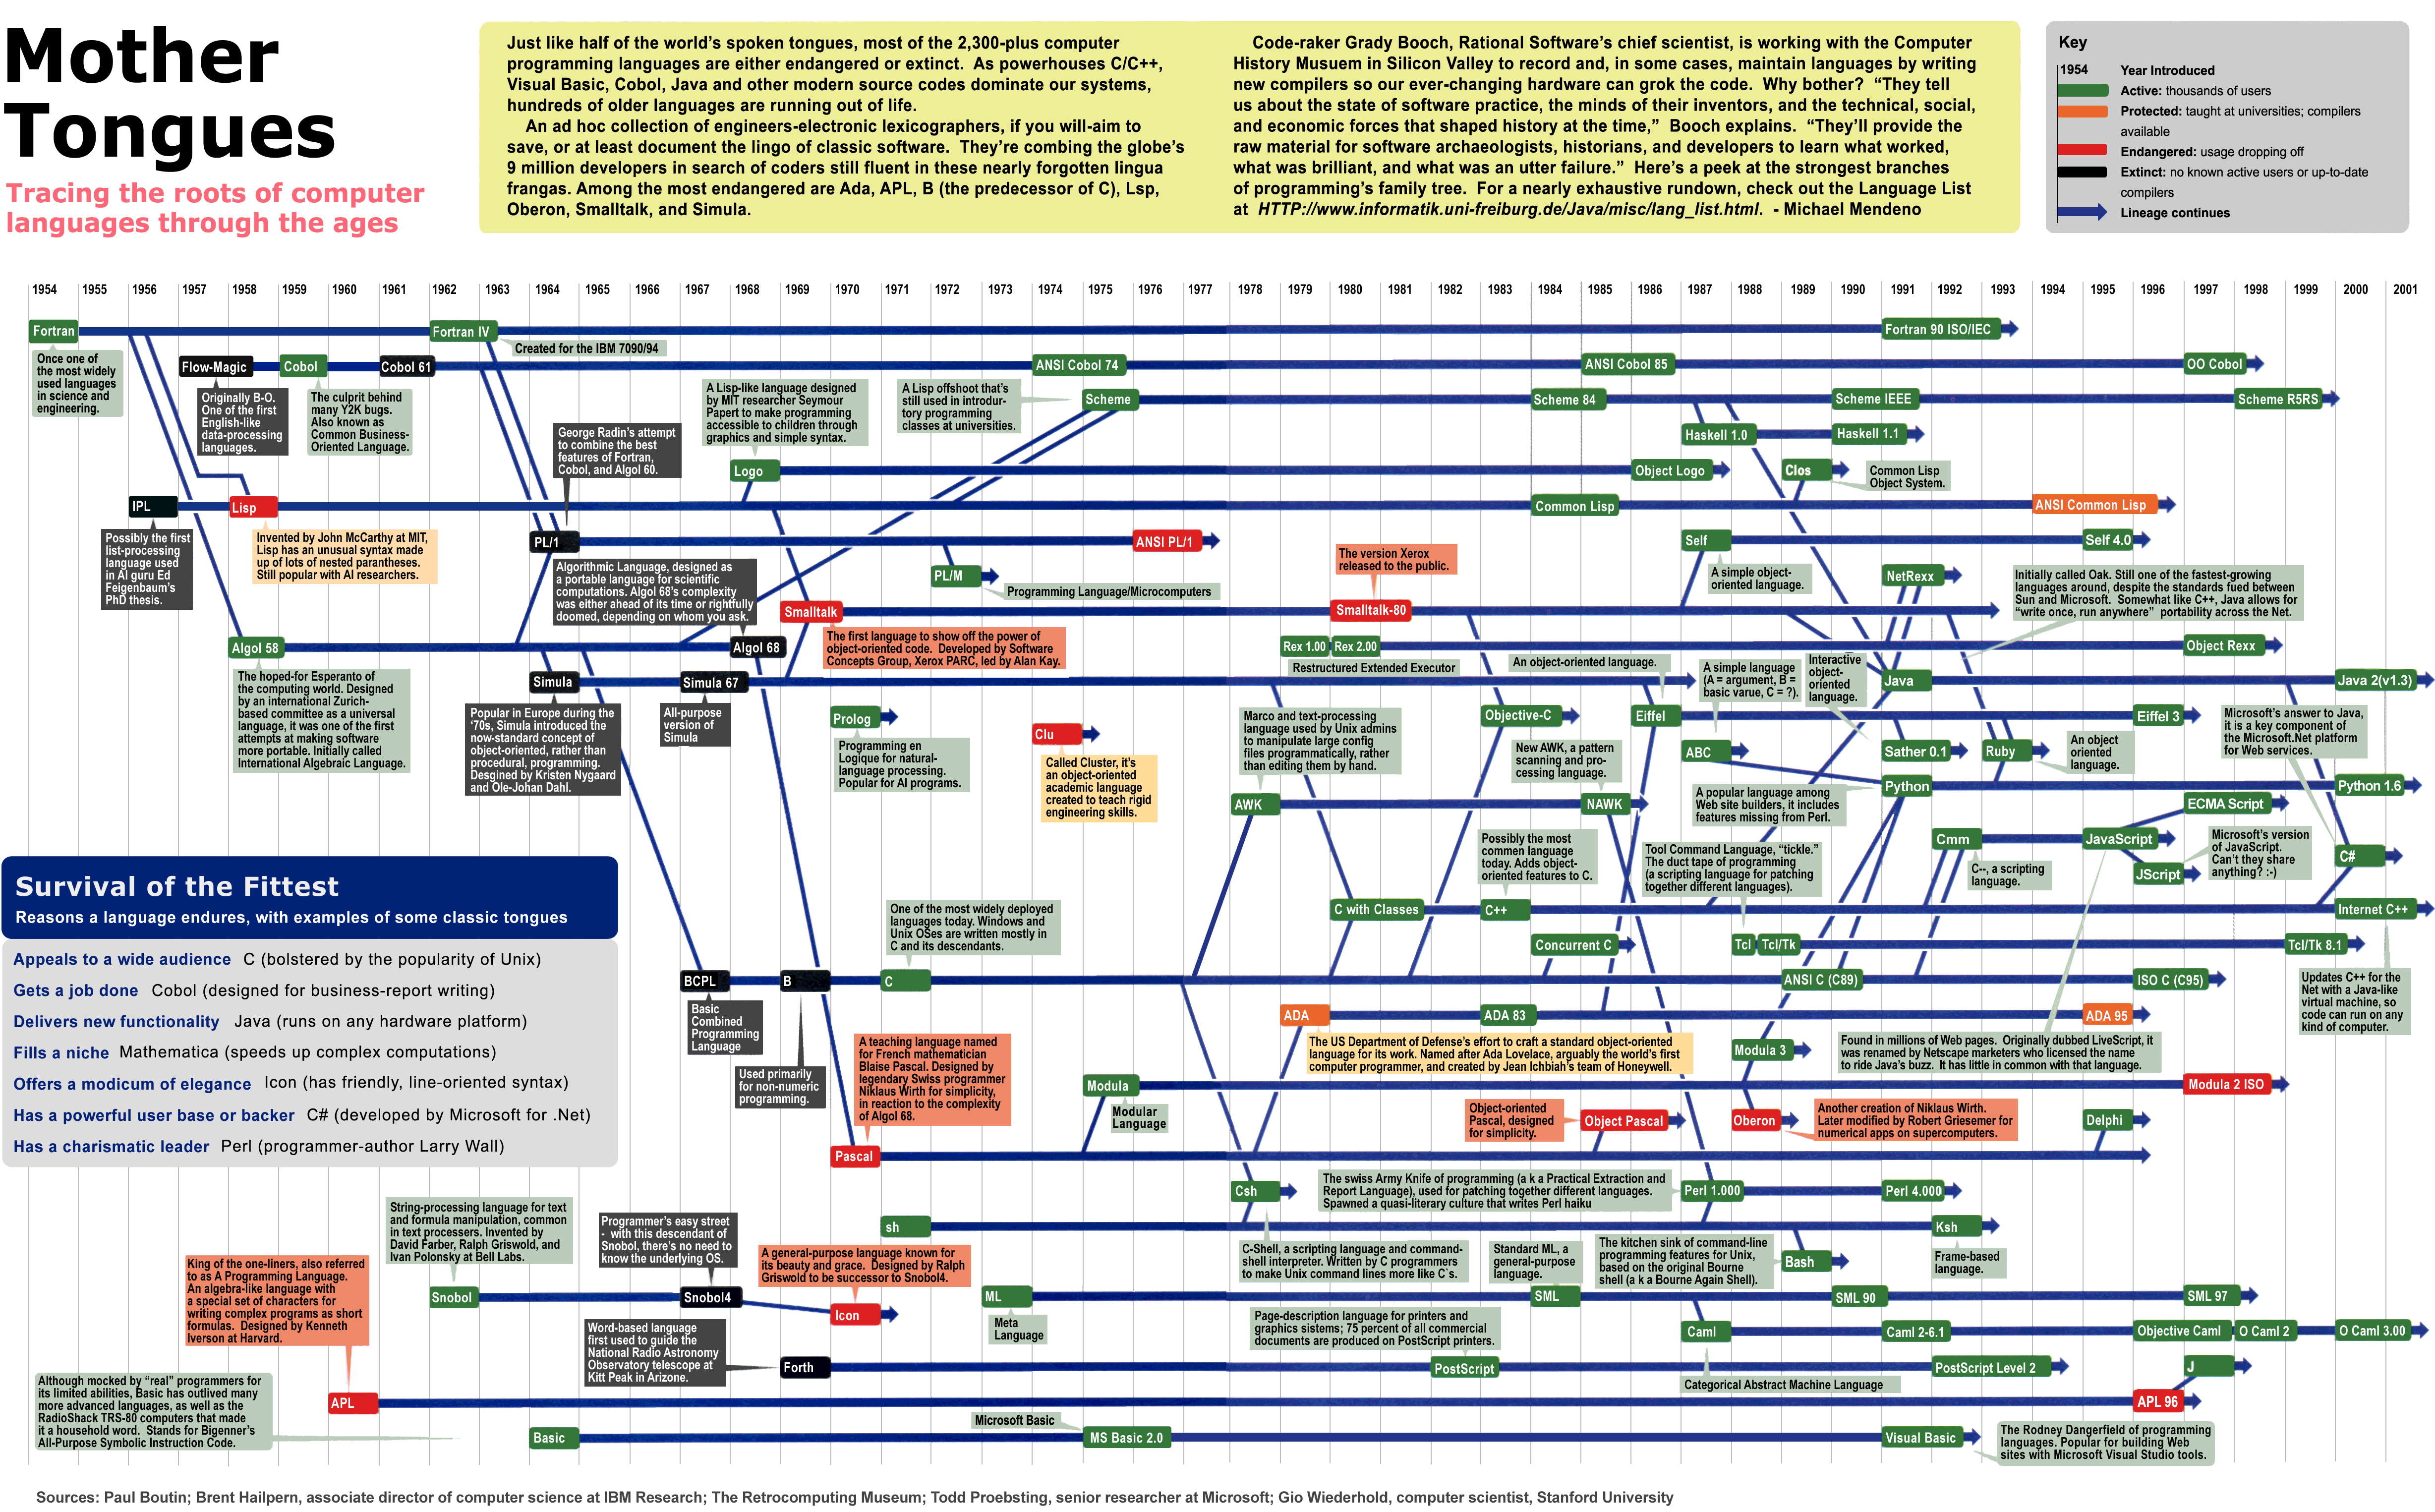
I found two similar posters, maybe you'll find interesting:
http://www.digibarn.com/collections/posters/tongues/Computer...
http://log-rotation.jp/pyblosxom/images/unix/programming_lan...
http://www.digibarn.com/collections/posters/tongues/Computer...
http://log-rotation.jp/pyblosxom/images/unix/programming_lan...

http://www.levenez.com/lang/
http://en.wikipedia.org/wiki/List_of_programming_languages_b...
http://en.wikipedia.org/wiki/Programming_paradigm
http://erlangish.blogspot.com/2007/05/shape-of-your-mind.htm...
http://www.sigplan.org/pl-workshop/contributions/7.pdf
http://lambda-the-ultimate.org/node/3465
http://www.info.ucl.ac.be/people/PVR/paradigmsDIAGRAMeng101....
http://en.wikipedia.org/wiki/List_of_programming_languages_b...
http://en.wikipedia.org/wiki/Programming_paradigm
http://erlangish.blogspot.com/2007/05/shape-of-your-mind.htm...
http://www.sigplan.org/pl-workshop/contributions/7.pdf
http://lambda-the-ultimate.org/node/3465
http://www.info.ucl.ac.be/people/PVR/paradigmsDIAGRAMeng101....
Not really too helpful that it only goes to 2006. It would be interesting to see how this looks with PEP 3003 in place (the moratorium on syntax changes) — maybe not much different, but maybe a lot different…
The chart excellent for visualizing one's contributions against and general activity. Would it be possible to generate a similar graph for other mainstream languages, gcc, and linux?
Wonder if the post-2005 spike would be similar for all interpreted languages, or just python.
Wonder if the post-2005 spike would be similar for all interpreted languages, or just python.
What visualization program was used to generate this graph?
The guy is the same that the code_swarm visualization: http://vis.cs.ucdavis.edu/~ogawa/codeswarm/ If you didnt see it before, go there and watch the impressive videos about eclipse, apache, python and postgres.
The guy is using processing.